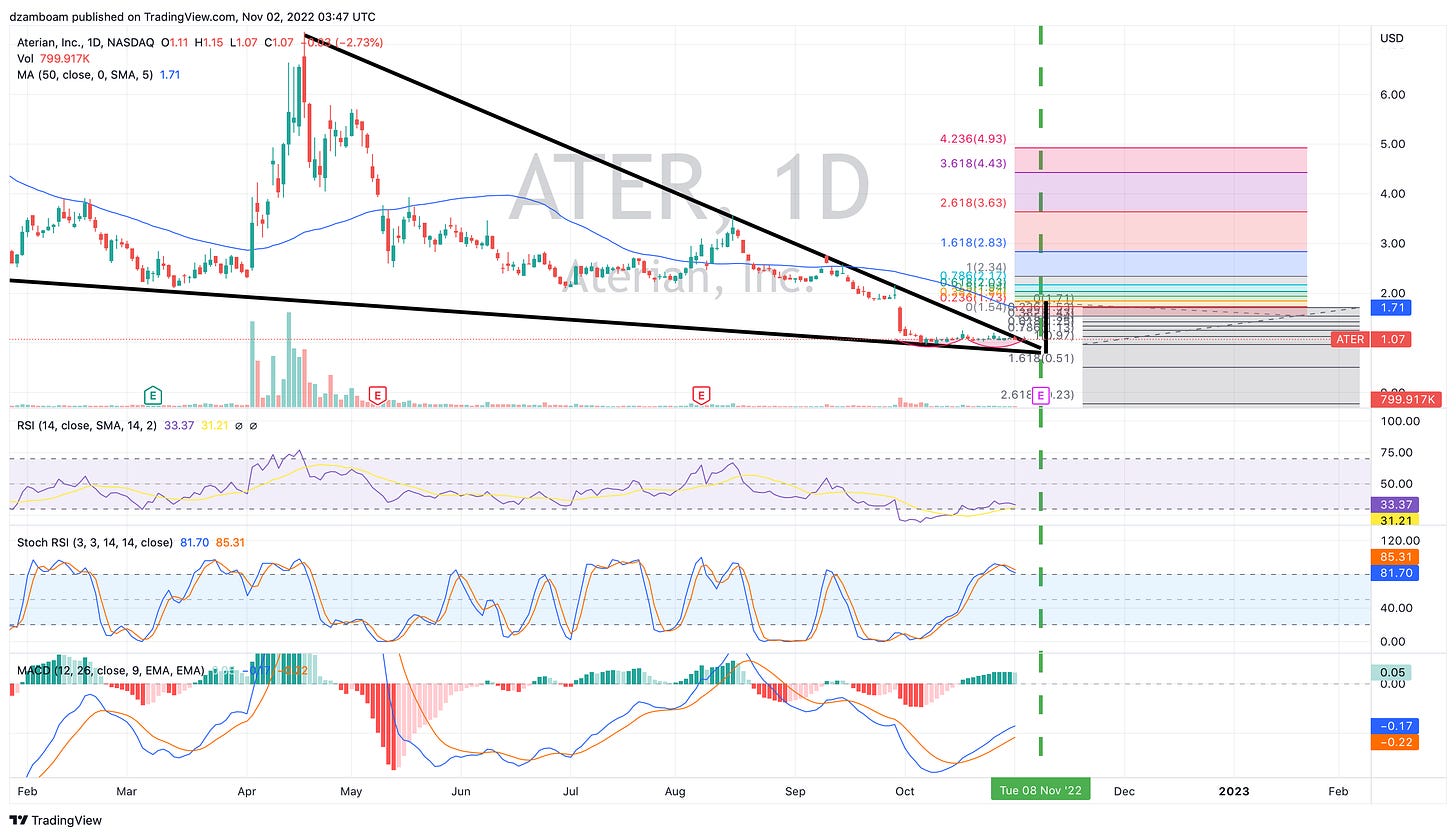
DZ's Mini $ATER Analysis: Tuesday's close (Nov. 1) and the wedge pattern
After a near breakout today, the "algos" managed to keep the price under the falling wedge.
Greetings fellow Aterians,
Following up with my most recent analysis — my running thesis that Aterian will break out of a massive daily wedge before its earnings report next week — ATER attempted a breakout today. For most of the day, it seemed like it might.
Here is ATER’s 1-hour chart:

Today was another light-volume day — around 800,000 shares traded to be exact — yet judging by the volume bars in the top and bottom panels (note the last red volume bar in the MACD chart especially), an end-of-day “stick-save” by the HFT algorithms seemed to save ATER 0.00%↑ from a close outside of this massive falling wedge.
To refresh everyone on this “massive falling wedge”, here is a zoomed-out version of ATER’s price chart (daily time frame):
The algorithms effectively stopped a breakout today. In essence, when the stock price closes outside of the wedge pattern here (especially on a LONG time frame as in this case… which has been developing since April), the price almost always breaks out in the direction of the wedge boundary. In this case, a close at $1.08 or above today (during normal hours) would have confirmed an imminent breakout to the upside.
Tomorrow, ATER can attempt a breakout again with a close at or above $1.06. The upper-boundary will move down 1-2 cents a day until the termination of this wedge, which will happen right at ATER’s earnings.
This is an obvious game by the algorithms (in my opinion anyways… it seems too obvious given the technical setup here) to keep the price contained within the wedge until we get to earnings.
As things come up over the coming days, I’ll be sure to note them in this space. I will also be working on an options analysis prior to the earnings. The options chain in ATER has hardly been active recently, but that’s not to say something can’t or won’t happen soon. If a “big player” tries getting into position before earnings, it will be noted as unusual options activity, and will share it when I see it.
Thanks all for reading!
Quick Plug: If you find my work educational and helpful for learning how the markets function, or help show you a couple techniques that help you learn something in your own trading journey, please consider supporting my work through either a free or paid subscription. Paid subscriptions help me subsidize costs on TradingView, UnusualWhales (and similar platforms) that help me put charts together and analyze data… and helps me buy an extra cup of coffee. All support is greatly appreciated!
Disclaimer: I am not a financial adviser, and nothing in this post should be taken as financial advice. This post is for educational purposes only, and all opinions presented reflect those of the author. The author, Dr. Andrew Dzambo is a Ph.D. in Atmospheric and Oceanic Sciences who’s main profession is academic research in the areas of cloud remote sensing and cloud physics… but has a passion for understanding global markets, especially in the context of how weather and climate patterns can affect the global economy.


One more thing, everytime I draw my wedge it seems to come to a point after earnings, like on the Friday, (Veteran's Day). Any significance, in your opinion?
DZ, can you post an updated view of your wedge with some updates on possibilities from here? It's getting interesting! Thanks!